The EU does not prescribe one tool, and authorities may use other data. This is a screening, not a forecast of an authority's conclusion.
How a check runs
We define the area, compare it with the forest baseline and later change data, apply consistent rules, then save the evidence with the result.
01
Defining the screening area
A boundary is used as the plot area. A point is checked within a 500 m surrounding area. If the location is coarse, suspect or unusable, it is not presented as plot-level precision.
Location precision The area that can be assessed depends on the geometry provided.
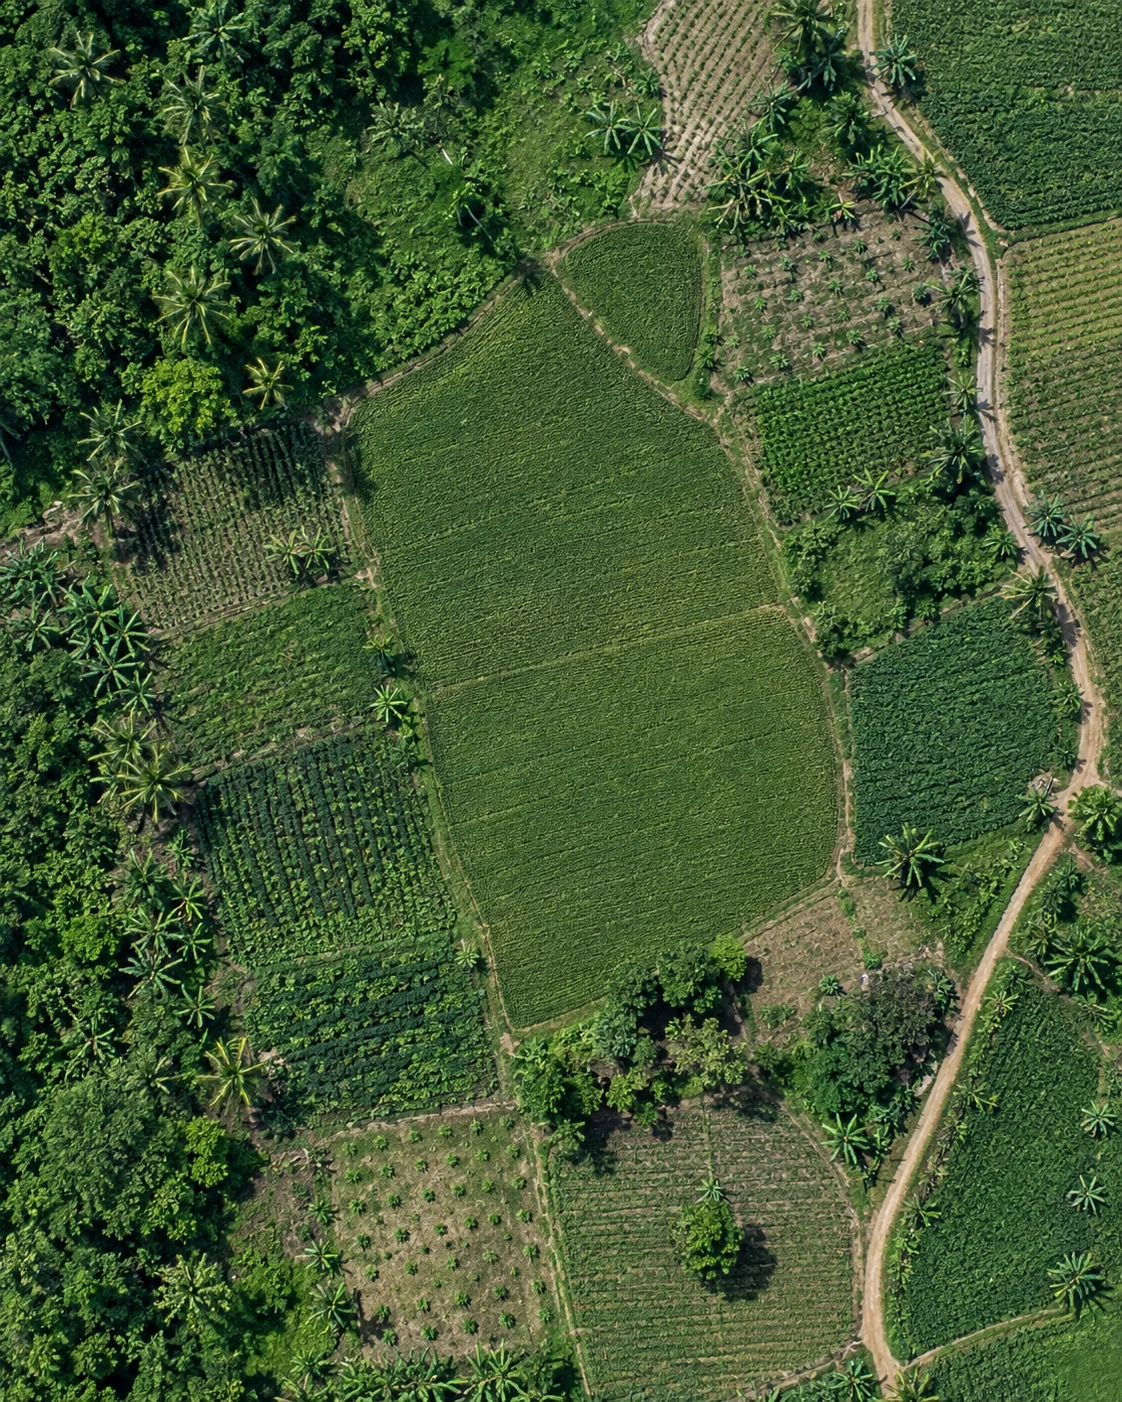
Illustrative agricultural landscape with a submitted boundary.
02
Comparing baseline and change layers
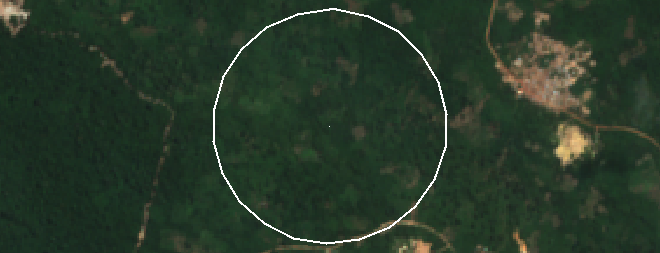
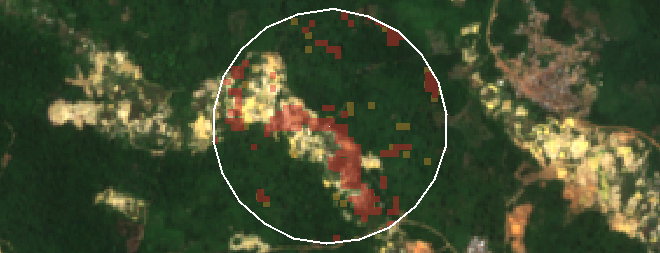
The Commission's GFC2020 map is our reference for likely forest extent in 2020. The system then checks later change in Hansen tree-cover loss and JRC Tropical Moist Forest data. Imagery supports review.
Data compared The same area is checked against the 2020 forest map and the change layers after it.
Before cutoff
After cutoff
Example imagery from a completed cocoa check.
03
Determining the screening result
The result follows the checked change layers, not a subjective score. A signal must cover more than 0.5 hectares before it changes the result. This is our own screening threshold, not an EU-prescribed one.
Context fields Recent alerts and country risk are useful context, but they do not create a Finding or Caution.
Loss on 2020 forestFindingWhen post-cutoff change passes the threshold.
Wood degradation, or loss outside the 2020 forest mapCautionThe map can miss forest, so this stays visible.
Recent alertsContextRADD and GLAD stay separate for your review.
04
Recording the screening result
Every result keeps the submitted location, checked area, outcome, reason, imagery and data-coverage note. It also records the screening date and the methodology and dataset versions used.
Re-screening A later check creates a new record. The earlier result stays intact.
Screening record
LocationBoundary or point assessed
EvidenceOutcome, imagery and coverage note
ProvenanceDate, method and dataset versions
Results
Each result says what we found in the submitted area, shows the supporting evidence, and suggests the next useful step.
Finding
Post-cutoff loss on 2020 forest
Tree cover was lost after the cutoff on land the EU's 2020 forest map shows as forest. It is a screening signal, not confirmed conversion to agriculture.
Recommended review
Confirm that the boundary is the production plot. Then review the detected area in the imagery alongside supplier and traceability records.
Caution
Wood degradation, or loss outside the 2020 forest map
Either a wood or timber plot shows degradation, or tree cover was lost where the EU's 2020 forest map shows no forest. That map can miss forest.
Recommended review
Check the imagery and the land-use history of the plot. For wood, review the supply chain too.
No signal
No change signal above the threshold
No signal does not mean compliant. It means no deforestation signal, or for wood and timber no degradation signal, passed the rule for the area in the datasets assessed.
Recommended review
Keep the result with supplier, origin and traceability evidence. A later check can be run if the location is refined or newer inputs become available.
No location
A usable location is needed
There was not enough usable location information to assess an area. This happens when no point or boundary is supplied, or when the location cannot be used.
Recommended review
Add or correct the point or, preferably, the plot boundary. A new check will create a separate result record.
Review context
Degradation that does not change the result
For wood and timber, forest degradation affects the EUDR result. For other commodities, the same signal remains visible as review context. It may be worth assessing, but it does not become a Finding or Caution.
How to use it
Review it with the imagery and your supply-chain evidence. It stays visible instead of being hidden behind No signal.
Limits of the EU forest map
It is a careful snapshot of 2020, not a perfect one. It finds about 92 of every 100 forest areas, and it leaves out cocoa, coffee, palm oil, rubber and soy plantations on purpose.
So when trees vanish where the map shows no forest, we do not ignore it. We mark it as a Caution and ask you to check.
Check a result yourself
Every dataset we use is public. You can open the same 2020 forest map, look at your plot, and compare it with recent satellite images.
A result is useful evidence, but it is not the whole due-diligence picture.
Vegetation and timing
Shade-grown canopy, agroforestry and cloud can make change harder to interpret. The main change layers update annually, so very recent clearing may not yet appear. Tree loss is not proof of conversion to agriculture.
Interpretation noteBefore-and-after imagery and a Finding help focus the next investigation.
Location precision
A boundary is the best way to represent a plot. A point is checked within 500 m around it, and a signal is not tied to the exact point. An address represents a wider area.
Interpretation notePlot boundaries provide the most precise result. Coarse locations are marked so they are not mistaken for plot-level results.
Not covered by the satellite check
The satellite check assesses forest change at a location. It does not show product origin, legality, land rights or supplier records. That evidence comes from you and your suppliers.
How it fitsKeep the result with your supplier, traceability and legality records as part of your due-diligence file. The workspace records your own legality assessment under the eight headings of Article 2(40), with your evidence and signed conclusion.
Data sources
We use named public datasets. Every export records the methodology and dataset versions used for that specific result.
MethodologyEUDR screening methodology v3
Recorded with each exportScreening date and dataset versions
No single method exists. The regulation lets authorities use any suitable data. We use the Commission's own 2020 forest map and definitions and the JRC's advice to combine datasets. An authority may still reach a different view.
What does a Finding mean?
Post-cutoff tree loss passed the screening threshold on land the EU's 2020 forest map shows as forest. Start with the plot imagery, submitted location and supply-chain evidence. It is not a legal finding.
Why is there a Caution?
EUDR treats forest degradation separately for wood and timber, so that signal is a Caution. Tree loss where the 2020 forest map shows no forest is also a Caution, because that map can miss forest.
What is the difference between No signal and No location?
No signal means we checked the location and no change signal passed the rule. No location means there was not enough usable location information to run the check.
What is checked about the locations themselves?
Coordinates must be valid and are kept to six decimals, no two plots may share a location, and outlines must be closed and must not cross themselves. A single point is accepted for plots up to 4 ha, and for cattle. We do not check that a location lies on the supplier's farm or that an answer is true: a plausible but wrong location passes every check, so keep supplier and traceability evidence with the result.
When should I use a plot boundary?
Use a boundary whenever you have one. It shows the area under review; a point identifies a location but cannot show the full extent of a plot.
How do updates affect earlier results?
They do not overwrite them. Each export keeps the methodology and dataset versions used when that check was run.